


Sankey Diagram with Set Action
- 2018年11月10日
- 読了時間: 1分
更新日:2019年3月30日

I'm super excited to share this topic. In the Tableau community there have been already many articles explaining the Sankey Diagram, but I hope the Set Action brought the chart to the next step. I hope you would enjoy this interactive chart and let's dive into it.
My workbook for this post is available here.
I created my Sankey Diagram following to the article below. The article explains clearly so please follow it and create your Sankey Diagram.


Once you finished creating yours, you will have something like the picture above.
The Stacked Bar Charts uses the percentage of total of "Chosen Measure".
For the sake of simplicity, let's set the dimension 1 and 2 static by editing the calculation field we made.


Then let's create Sets with the Dimension1 and Dimension2.


Then create 2 calculations below.
Dynamic Dimension 1
IF [Dimension 1 Set] THEN [Sub-Category] ELSE [Category] END
Dynamic Dimension 2
IF [Dimension 2 Set] THEN [State] ELSE [Region] END
Then let's go back to the Sankey Diagram and arrange the items like the picture below and edit each table calculations of "Sankey Polygons" on the row shelf. The other calculations don't need to be edited.


Then you should get the result below.

Let's edit the Stacked bar Charts too.


Then put all of them in a dashboard and let's quickly check if it is arranged correctly.

Finally it's time to set the Set Actions and some Action Highlighter.


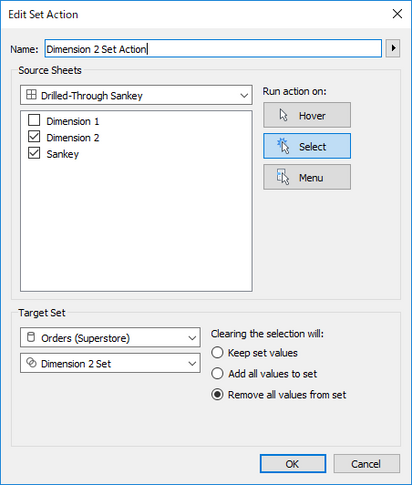


Let's enjoy the interactive Drilled-through Sankey Diagram.

I hope you have made it to the end. If you faced problems through creating the chart please let me know on Twitter or Linkedin.
I also hope you have enjoyed this post. Happy visual analytics.